A lot of individuals, startups, small and large businesses have been using infographics (information graphics) as part of their content marketing strategy lately. One of the reasons for this is that it is a cool way of creating content, and when done properly, visual marketing can generate some good amount of exposure and traffic to its creator. Data visualization has always worked. It has been present for a very long time in various forms and we probably were just not aware of it. Think subways maps, charts, restaurant menus, etc. Organizing content in a visual way helps people understand content quickly and easily.
Just like anything else, infographics has evolved and today they are widespread, and being shared all over the place. Pinterest, the image based social network is one good example of just how popular they are. As I mentioned earlier, when done properly, it could bring huge benefits for its original creator. While making use of infographics as part of your content marketing campaign is great, it does need to be interesting, informative and add value for users. Creating them with useless information will not make it, despite it being pretty looking. Also, you may want to steer away from making infographics solely for the purpose of link building. That is not a wise move. Rather create really great stuff, promote it on authority sites (Pinterest, FaceBook, Visual.ly, Reddit, NerdGrapg, etc.) and let it flow naturally.
Related: Splashing Ways to Market Your Content on the Web
What kind of infographics can you create?
Many kinds. Some examples include…
- Insights – Providing interesting data around topics that is is new, popular, etc.
- How to – Compiling some step-by-step instructions on a specific topic, recipe for example.
- Humor – Research some fun stats about a topic and present it on a visual way
- Chronological – List the history of the evolution of an event. The growth of a social network for example, like Google+ or evolution of WordPress
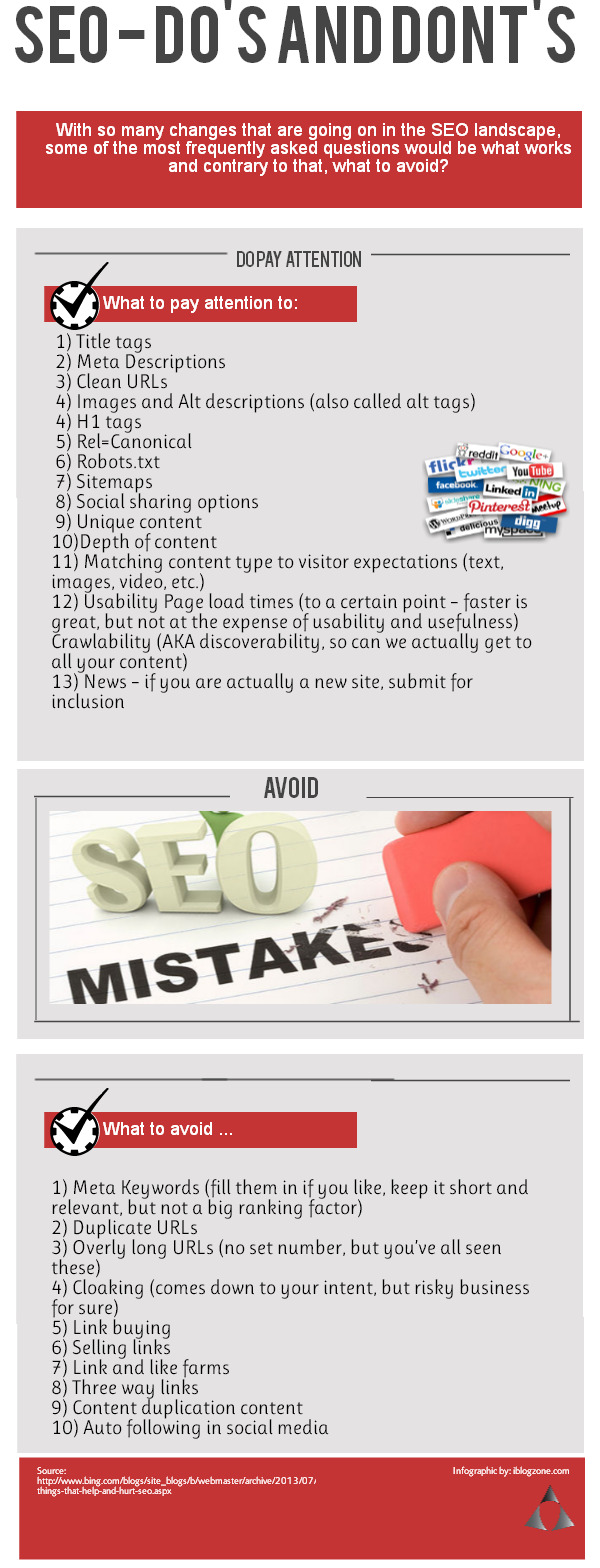
- Checklists – List of do’s and dont’s (see my example below)
- etc…
How To Create Infographics?
There are some steps you have to take in order to create a good infographic. Just like any other type of content, they should include interesting and informative content so that you can draw peoples attention to it.
Recommended steps to creating an infographic.
1) Research the data first – This is probably the most important element when creating an infographic. Visit websites or search on Google some hard facts around your chosen topic. Search for information such as “WordPress stats”, “Facebook growth or market share”, “SEO tips and resources”, “best places to travel”, “list of natural …”, etc.. you get the picture.
2) Organize your content – Once you have gathered the data you need, start organizing them the way you want it to be presented. Think storyline, order of importance, etc..
3) Create/Design your infographic, publish and promote.
Now you may be asking, how do I create/design the infographic?
There are many ways and options to create an infographic. You can hire a designer, which can cost you an arm and a leg, or you can make use of tools that are made for this purpose. One such tool is PikToChart, the infographic and presentation tool for non-designers.
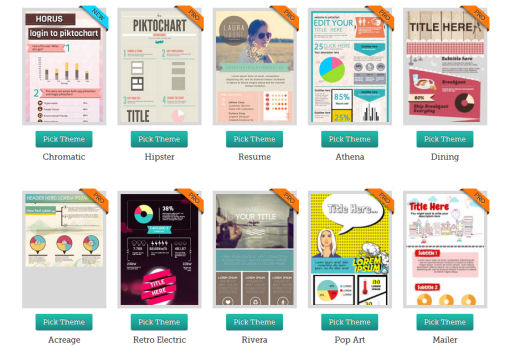
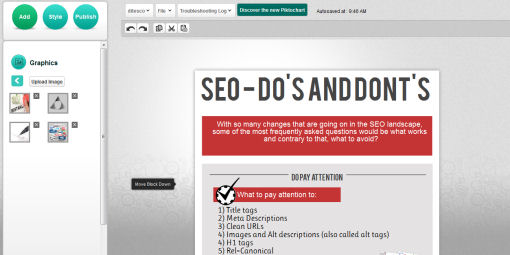
PikToChart allows anyone with no skills to create beautiful infographics easily. The interface is very intuitive, comes with a variety of ready made templates, drag and drop functionality, and a wide set of tools to make infographic creation a breeze. Getting started may get you a bit confused, considering the amount of options available. For that, they have a great tutorial section that walks you through step-by-step on how to create stunning infographics. Essentially, after signing up for your free account, you start by selecting a template, enter your data, do some design tweaks, save and publish. That’s it!
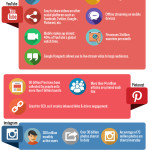
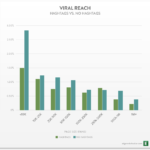
Here’s an example of one infographic I created. While not so pretty (I know, just did enough to show you an example), the information is real. Now and while you are at it, go and share it, lol.
 BTW, the free account is “forever free”. The limitation is that you have only 6 templates to choose from, limited to 10 images to upload and branded by PikToChart. If you want remove some of the limitations, you will have to upgrade to one of their very accessible plans.
Now for the good news. The fine folks from PikToChart has been kind enough to offer three lucky readers of iblogzone.com, a full one year PRO account for each. All you have to do is follow the simple set of instructions below and you are good to go.
Winners will be announced 15 days from now, here and via email.
That’s it! Good luck and to your success!
This post brought to you by PikToChart.com




Comments are closed.